


APL - “E. Fermi” building - Webcam
APL - “E. Fermi” building - SkyBAQ


APL - “E. Fermi” building - SkyNASA


APL - “G. Marconi” building - SkyNASA


Pandora´s measurements in different sites


For each BAQUNIN site (APL, CNR-ISAC and CNR-IIA) and for Air Force Meteorological Station of Pratica di Mare (LIRE – AM) the following three figures are produced on daily basis (current day at 00:00 UTC + 36 hours forecast):
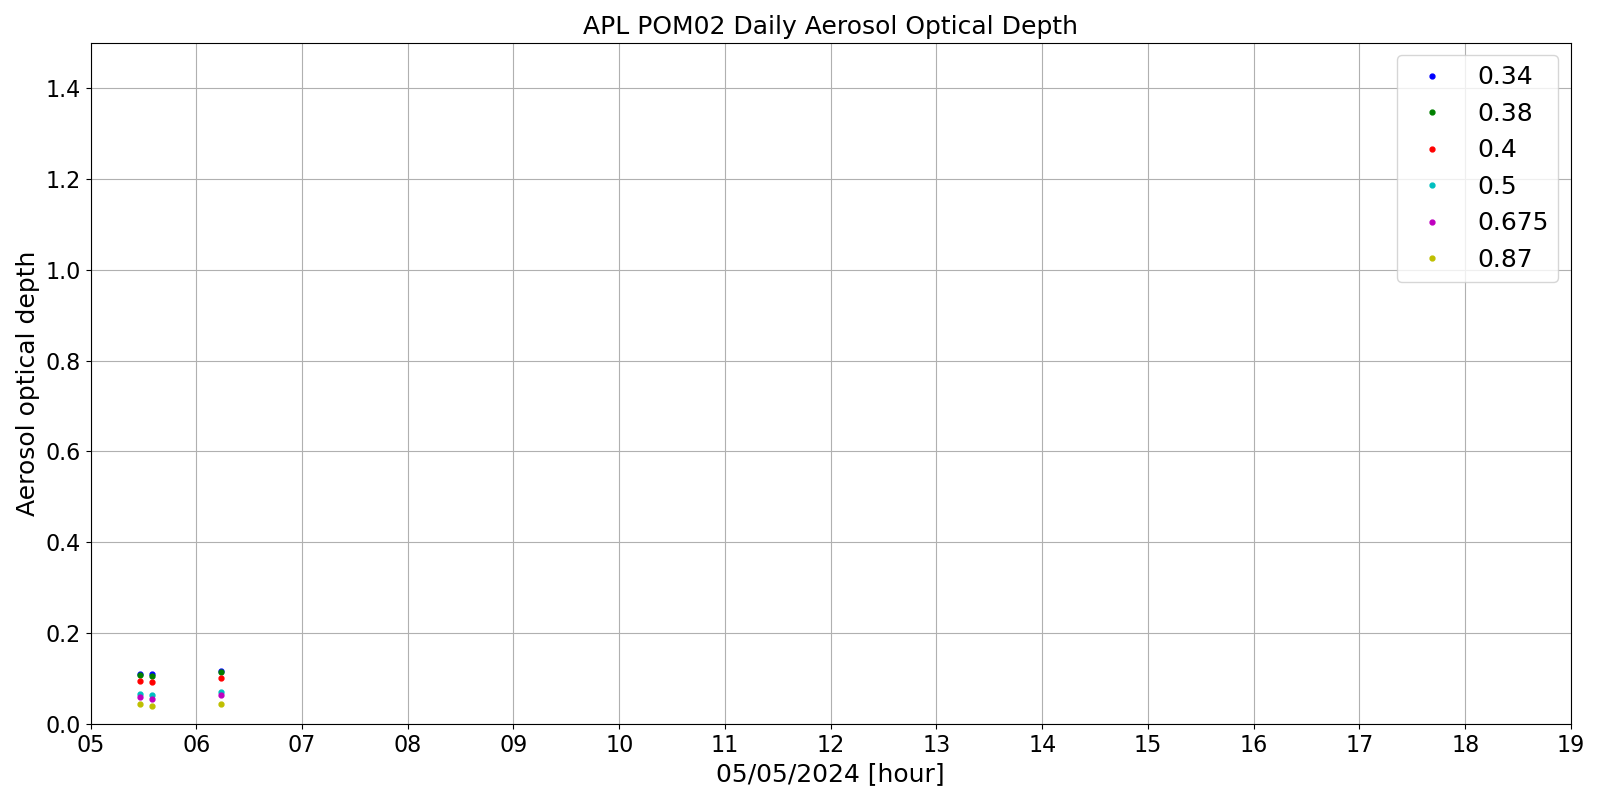
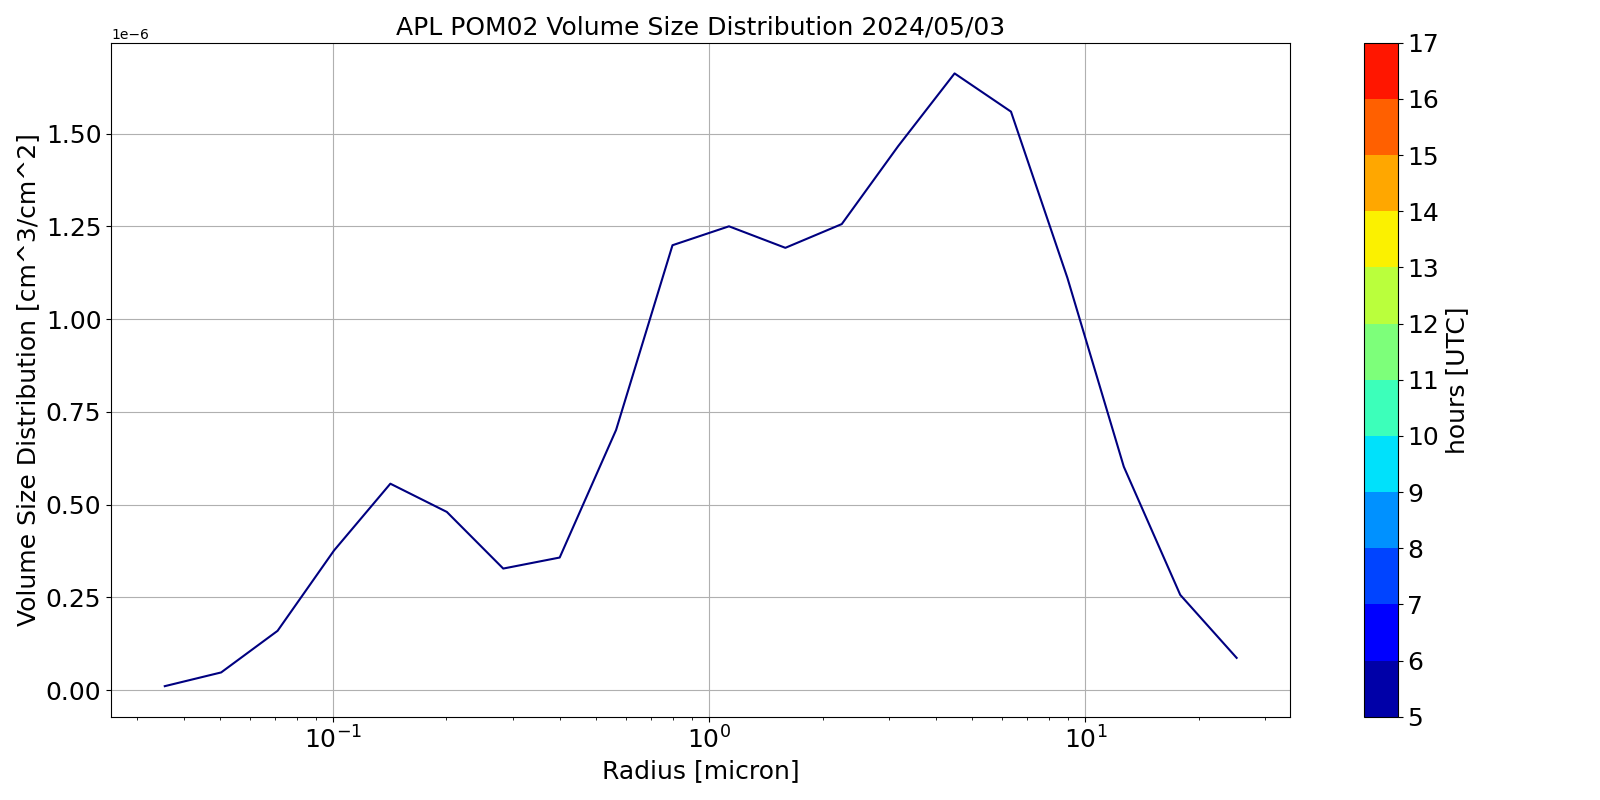
Atmospheric Physics Laboratory (APL)


Istituto sull'Inquinamento Atmosferico (CNR-IIA)


Istituto di Scienze dell'Atmosfera e del Clima (CNR-ISAC)


Pratica di Mare (LIRE - AM)


Figure 1
a) relative humidity (%) vertical profile evolution
b) planetary boundary-layer height (PBLH, m) evolution
c) 2m relative humidity (%) evolution
Figure 2
a) cloud coverage vertical profile evolution
b) mean sea level pressure (PMSL, hPa) evolution
c) 2m relative humidity (%) evolution
Figure 3
a) temperature vertical profile (K) evolution
b) mean sea level pressure (PMSL, hPa) evolution
c) 2m temperature (K) evolution
Time (abscissa) is reported as DD_HH, where DD is the current day of month and HH is the hour of the day. In all upper panels dedicated to the vertical profile evolution, the horizontal wind speed and direction is also reported for each altitude and time (small arrow)


