


Real time graph of the irradiance (Blue), the standard deviation (red) and internal instrument temperature (yellow)


Pressure real time graph


The following figures show the daily averages of Pandora products compared with statistical trends. The products examined are NO2 (total, tropospheric and superficial), O3 (total), Water vapor (tropospheric and superficial).
Top panel: Daily mean results
- red dots with red bars: daily mean value of the variable with square sum of daily standard deviation and daily mean uncertainty
- blue line: reference climatology value with standard deviation (turquoise area)
Bottom panel: Deviation from climatology mean
- red dots with red bars: relative deviation of the daily mean value with respect of the climatology with relative square sum of daily standard deviation and daily mean uncertainty
- turquoise area: climatology standard deviation divided climatology mean (the blue line highlight the zero value)
Atmospheric Physics Laboratory (APL)


Istituto di Scienze dell'Atmosfera e del Clima (CNR-ISAC)


The graphs show the trend during the day of the UV index (UVI) obtained from Brewer spectrophotometer measurements in UVA -UVB range. The UVI is a relevant quantity expressing the levels of UV radiation potentially harmful to human health . According to the scale adopted and standardized by the World Health Organization (WHO) and the World Meteorological Organization (WMO), UVI values between 3-7 indicate Moderate/High level of risk for sun exposure; for values greater than 8 the risk becomes Very High/Extreme.


For each BAQUNIN site (APL, CNR-ISAC and CNR-IIA) and for Air Force Meteorological Station of Pratica di Mare (LIRE – AM) the following three figures are produced on daily basis (current day at 00:00 UTC + 36 hours forecast):
Figure 1
a) relative humidity (%) vertical profile evolution
b) planetary boundary-layer height (PBLH, m) evolution
c) 2m relative humidity (%) evolution
Figure 2
a) cloud coverage vertical profile evolution
b) mean sea level pressure (PMSL, hPa) evolution
c) 2m relative humidity (%) evolution
Figure 3
a) temperature vertical profile (K) evolution
b) mean sea level pressure (PMSL, hPa) evolution
c) 2m temperature (K) evolution
Time (abscissa) is reported as DD_HH, where DD is the current day of month and HH is the hour of the day. In all upper panels dedicated to the vertical profile evolution, the horizontal wind speed and direction is also reported for each altitude and time (small arrow)
Atmospheric Physics Laboratory (APL)


Istituto sull'Inquinamento Atmosferico (CNR-IIA)


Istituto di Scienze dell'Atmosfera e del Clima (CNR-ISAC)


Pratica di Mare (LIRE - AM)


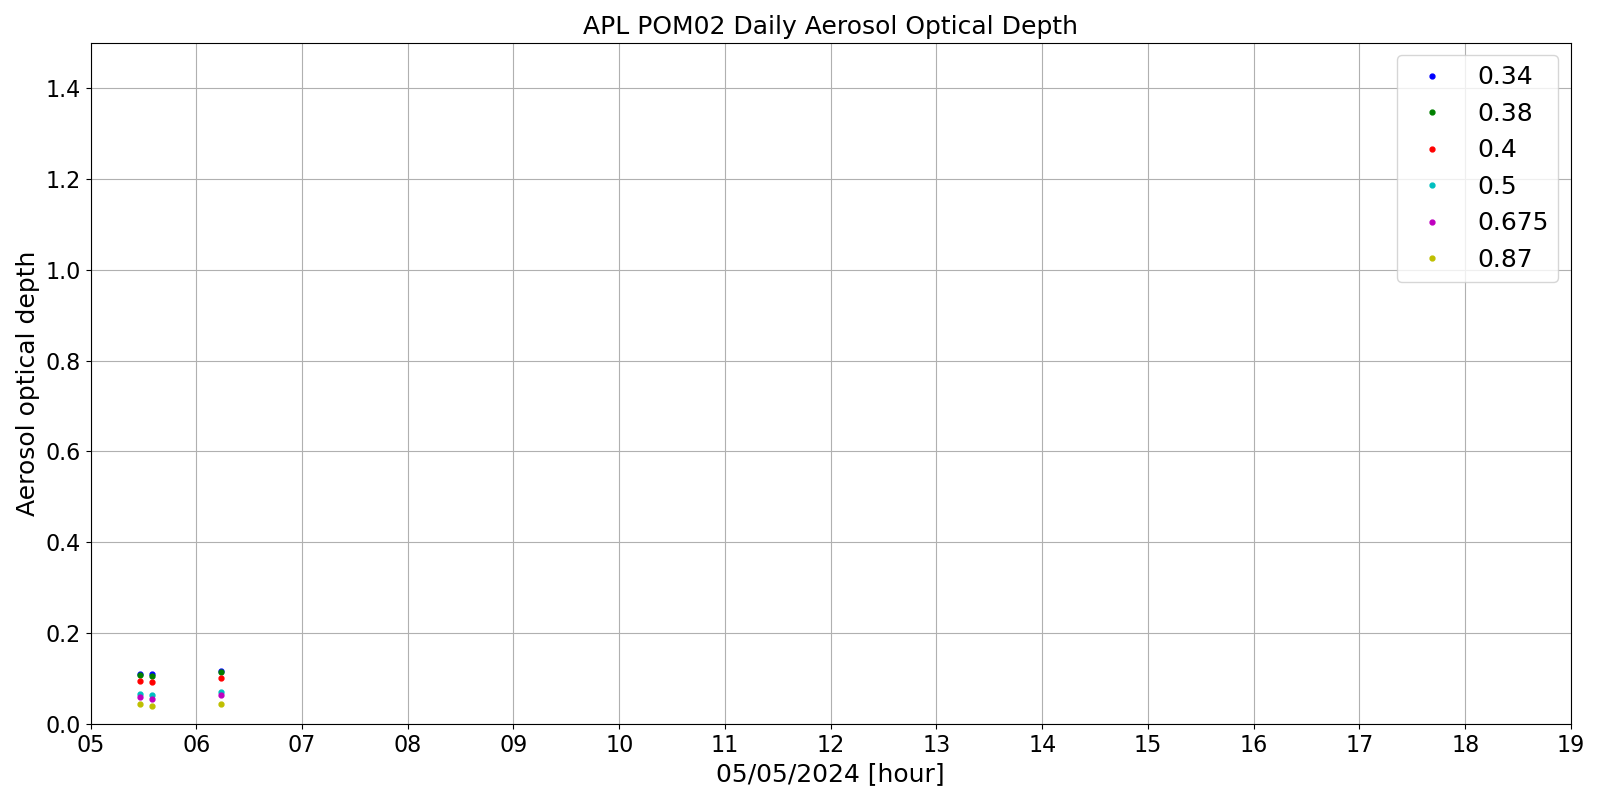
AOT_Daily
Aerosol Optical thickness diurnal behaviour at 500 nm; Angstrom exponent diurnal behaviour, obtained using all the wavelengths.
AOT_Monthly
Aerosol Optical thickness during the month at 500 nm; Angstrom exponent during the month, obtained using all the wavelengths.
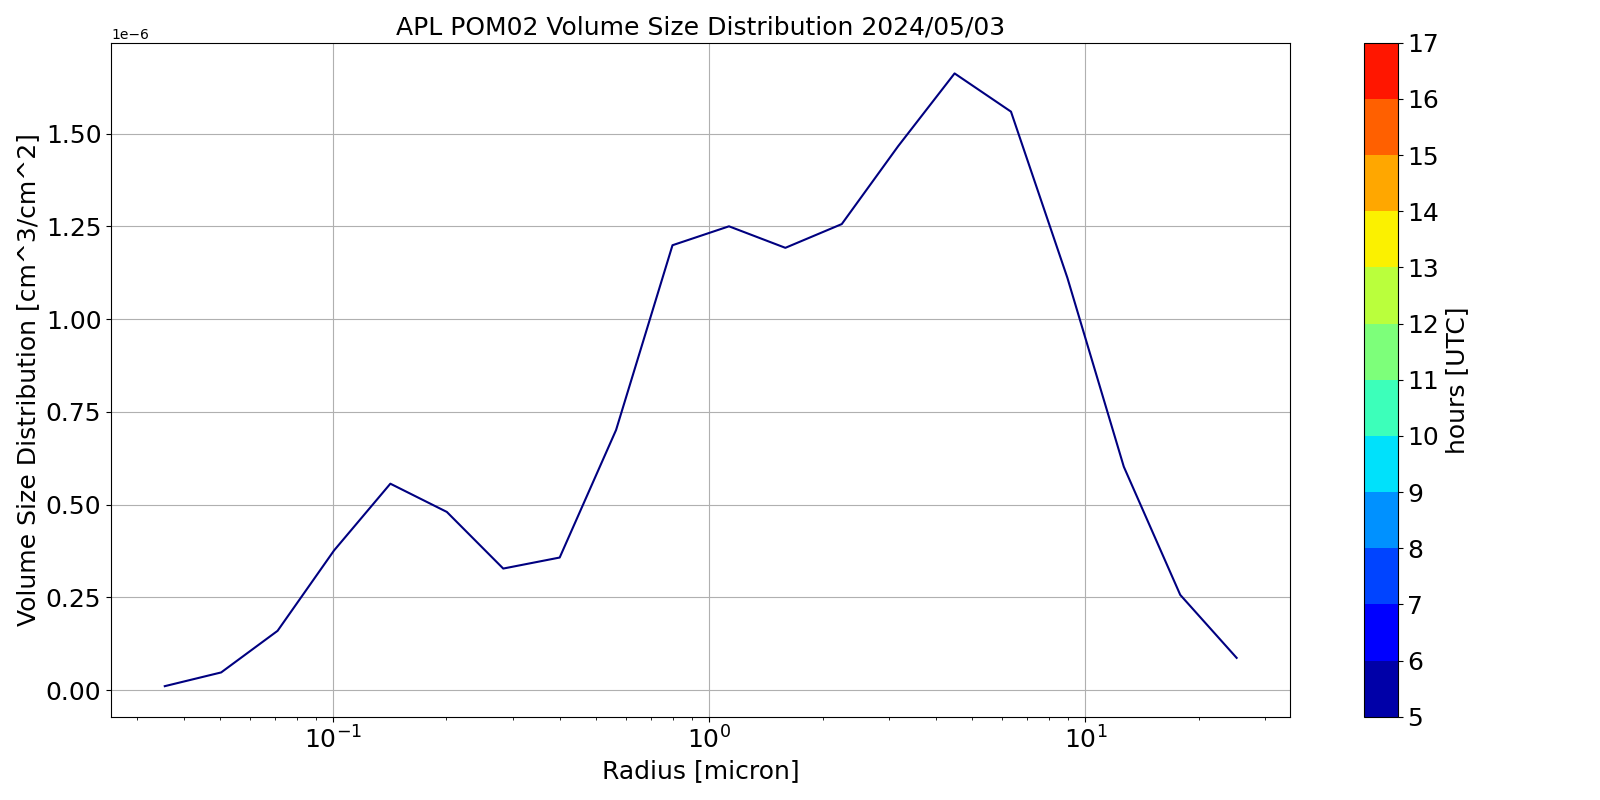
VSD_Daily
Volume size distribution diurnal behaviour. The colors refer to the hours.
Atmospheric Physics Laboratory (APL)

The following figures are quick looks of the daily acquisitions of RAP Lidar. In particular, the logarithm of the Range Corrected Signal [Log(RCS)] is shown.


Last images of the sky camera installed at APL location, Physics Department | First two images building “E. Fermi” | Last image building “G. Marconi”


